<?xml version="1.0" encoding="utf-8"?><feed xmlns="http://www.w3.org/2005/Atom" ><generator uri="https://jekyllrb.com/" version="3.10.0">Jekyll</generator><link href="https://thaarushin.github.io/feed.xml" rel="self" type="application/atom+xml" /><link href="https://thaarushin.github.io/" rel="alternate" type="text/html" /><updated>2026-07-23T21:02:19+05:30</updated><id>https://thaarushin.github.io/feed.xml</id><title type="html">Thaarushi Herath - AI Engineer</title><subtitle>Portfolio and tech blog by Tharushi Herath — AI/ML Engineer and Data Science graduate passionate about building intelligent systems that connect data, engineering, and real-world impact.  Showcasing projects in Machine Learning, AI Engineering, Computer Vision, Edge AI, and LLM-based applications.  Featuring hands-on guides, documentation, and insights on deploying practical AI solutions using FastAPI, Azure, and modern MLOps tools.  Built to learn, share, and inspire the next generation of AI-driven innovation.</subtitle><author><name>Thaarushi Herath</name></author><entry><title type="html">Winning Super AI’s NEXT Hackathon 2026</title><link href="https://thaarushin.github.io/2026/07/07/winning-super-ais-next-hackathon-2026/" rel="alternate" type="text/html" title="Winning Super AI’s NEXT Hackathon 2026" /><published>2026-07-07T12:00:00+05:30</published><updated>2026-07-07T12:00:00+05:30</updated><id>https://thaarushin.github.io/2026/07/07/winning-super-ais-next-hackathon-2026</id><content type="html" xml:base="https://thaarushin.github.io/2026/07/07/winning-super-ais-next-hackathon-2026/"><![CDATA[<h1 id="winning-super-ais-next-hackathon-2026">Winning Super AI’s NEXT Hackathon 2026</h1>

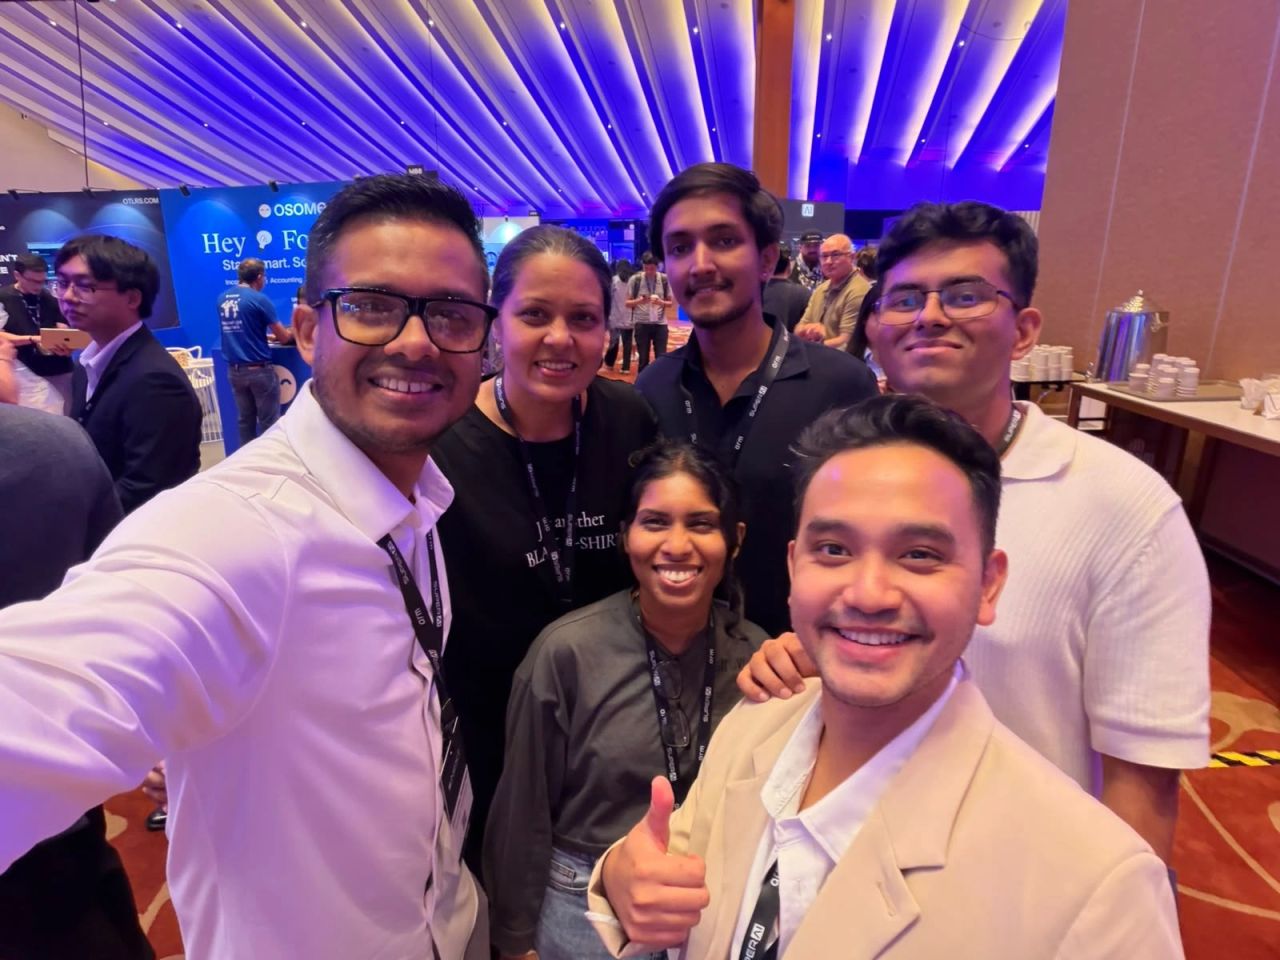
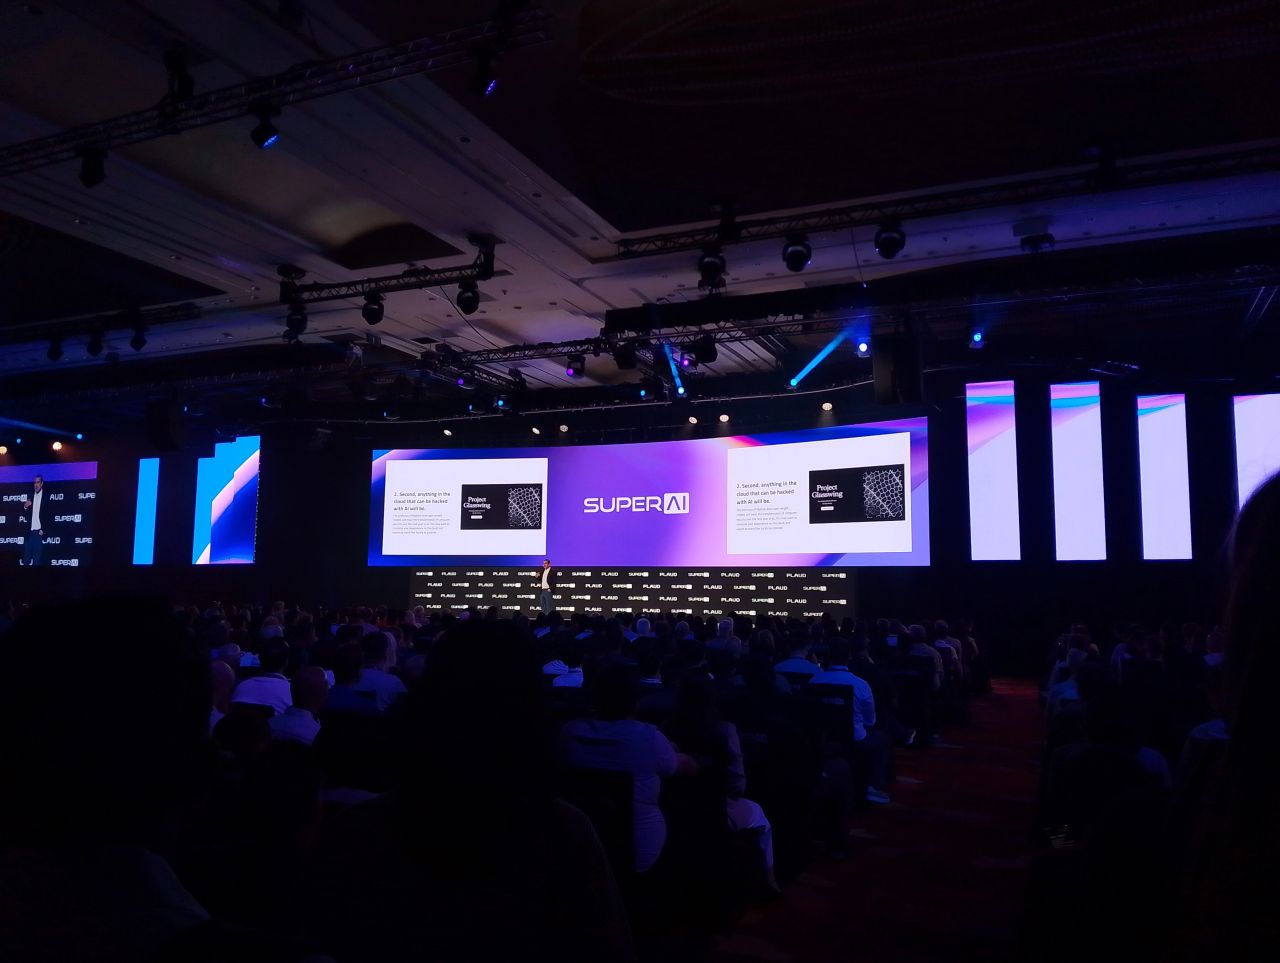
<p>On the 8th of June 2026, our team at sixn.ai flew to Singapore all the way from Colombo to participate in NEXT Hackathon 2026. This year’s hackathon theme was Agentic AI applications. Our project was <strong>Bloom</strong>, a multi-agent fashion companion that helps you build your dream wardrobe.</p>

<p>I am happy to announce that our team has become one of five overall winners and also won the category <strong>Best Use of Stripe</strong>.</p>

<figure class=""><img src="/assets/images/hackathon/1781241967084.jpeg" alt="NEXT Hackathon 2026" /><figcaption>
      

    </figcaption></figure>

<figure class=""><img src="/assets/images/hackathon/1781241967538.jpeg" alt="NEXT Hackathon 2026" /><figcaption>
      

    </figcaption></figure>

<figure class=""><img src="/assets/images/hackathon/1781241974037.jpeg" alt="NEXT Hackathon 2026" /><figcaption>
      

    </figcaption></figure>

<figure class=""><img src="/assets/images/hackathon/Hackathon-260611-144240-PB2_2720.jpg.jpeg" alt="NEXT Hackathon 2026" /><figcaption>
      

    </figcaption></figure>

<p>Read about it here: <a href="https://www.sundaytimes.lk/260705/business-times/ai-company-sixn-ai-wins-at-asias-largest-ai-hackathon-647818.html">AI company sixn.ai wins at Asia’s largest AI hackathon — Sunday Times</a></p>]]></content><author><name>Thaarushi Herath</name></author><category term="AI" /><category term="Agents" /><category term="Hackathon" /><category term="Hackathon" /><category term="Agentic AI" /><category term="Multi-Agent Systems" /><category term="Stripe" /><category term="Singapore" /><category term="SuperAI" /><summary type="html"><![CDATA[Our team at sixn.ai won at Asia's largest AI hackathon — Super AI's NEXT Hackathon 2026 in Singapore — with Bloom, a multi-agent fashion companion.]]></summary></entry><entry><title type="html">Building Bloom: A Multi-Agent AI Stylist with Reflection Loops, Durable Workflows, and Human-in-the-Loop Checkout</title><link href="https://thaarushin.github.io/2026/06/13/building-bloom-a-multi-agent-ai-stylist/" rel="alternate" type="text/html" title="Building Bloom: A Multi-Agent AI Stylist with Reflection Loops, Durable Workflows, and Human-in-the-Loop Checkout" /><published>2026-06-13T12:00:00+05:30</published><updated>2026-06-13T12:00:00+05:30</updated><id>https://thaarushin.github.io/2026/06/13/building-bloom-a-multi-agent-ai-stylist</id><content type="html" xml:base="https://thaarushin.github.io/2026/06/13/building-bloom-a-multi-agent-ai-stylist/"><![CDATA[<h1 id="building-bloom-a-multi-agent-ai-stylist-with-reflection-loops-durable-workflows-and-human-in-the-loop-checkout">Building Bloom: A Multi-Agent AI Stylist with Reflection Loops, Durable Workflows, and Human-in-the-Loop Checkout</h1>

<p>I and my team at Sunchain Technologies had the opportunity to attend SuperAI 2026 held in Marina Bay Sands, Singapore and participate in their NEXT hackathon. This year’s hackathon focused on agentic AI and this is the project that got us up the big stage as winners.</p>

<h2 id="the-problem">The Problem</h2>

<p>Currently when you want to find an outfit for an occasion, you have to have several tabs open, browse through several brands and sites and build your outfit in your mind. If you are an absent minded person like me you have to screen shot everything and do the comparison as well.</p>

<p>What our application ‘Bloom’ does is lets you do this with the help of agentic flows.</p>

<p>First, we wanted to create a single agent that helped user find what they want for an occasion and/or an aesthetic. Then we understood the process of selecting outfits was not linear and simple as we thought. We often look at what the store has, filter things out, pick few choices, fit on, ask our friends for criticism and if we don’t like what we chose, we go back and browse items again.</p>

<p>To emulate this process, we had to create multiple agents.</p>

<h2 id="features">Features</h2>

<p>Ability to select an occasion and an aesthetic trend you want to follow.</p>

<p>Browse outfits from several different brands and pick.</p>

<p>Virtual try-on the assembled outfit by uploading a full body picture of yourself.</p>

<p>Save and like the outfits you like.</p>

<p>Get recommendations for your preferences.</p>

<hr />

<h2 id="agentic-workflows">Agentic Workflows</h2>

<p>Bloom is a full-stack application: a Next.js 16 / React 19 frontend, a FastAPI backend, PostgreSQL with pgvector for semantic search, and a Chrome extension for on-page styling.</p>

<p>We created multiple agents to assist user.</p>

<table>
  <thead>
    <tr>
      <th>Agent</th>
      <th>Task</th>
    </tr>
  </thead>
  <tbody>
    <tr>
      <td>Stylist Agent</td>
      <td>Evaluates outfits fetched by Researcher, provides explanations to users and decides whether to browse databases, online catalogues etc (a ReAct loop).</td>
    </tr>
    <tr>
      <td>Style Critic</td>
      <td>Determines whether or not to proceed with stylist agents choices and if the choices does not seem satisfactory, re-initiates the loop.</td>
    </tr>
    <tr>
      <td>Sourcing Planner</td>
      <td>Determines which brands, web pages and catalogues to search as well as which keywords to use to fetch all the relevant products.</td>
    </tr>
    <tr>
      <td>Supervisor Agent</td>
      <td>Supervisor agent is an agent that runs at the system levels and supervises the tasks and context. Dynamically routes between steps based on runtime conditions, what the catalog yielded, whether the critic approved, whether the user has a budget set. It also makes sure that Stylist and Style Critic are not stuck in an eternal loop going back and forth.</td>
    </tr>
    <tr>
      <td>Checkout Agent</td>
      <td>The agentic flow that helps you checkout multiple items from multiple brands and sites with a single cart using Stripe payment gateway.</td>
    </tr>
  </tbody>
</table>

<p>In addition to the agentic flows, there are other core functionalities and tool calls that support this process.</p>

<table>
  <thead>
    <tr>
      <th>Function</th>
      <th>Purpose</th>
    </tr>
  </thead>
  <tbody>
    <tr>
      <td>Researcher</td>
      <td>Tool that calls Exa API to get weather, fashion trends, dress codes etc. Works in tandem with Sourcing Planner.</td>
    </tr>
    <tr>
      <td>Personalizer and Preference Engine</td>
      <td>Executes to logic to add preference weights to each item that fits user description based on user’s past preferences and choices.</td>
    </tr>
    <tr>
      <td>Budgeting Tool</td>
      <td>Executes logic to evaluate every single article of clothing and outfits so user can have something from their budget range.</td>
    </tr>
  </tbody>
</table>

<hr />

<h2 id="virtual-try-on-gemini-vision-with-identity-locking">Virtual Try-On: Gemini Vision with Identity Locking</h2>

<p>After the agents assemble an outfit, the user can see themselves wearing it. Bloom uses <strong>Google Gemini 3.1 Flash Image</strong> for virtual try-on , a multimodal model that composites the user’s photo with the selected garments.</p>

<p>The challenge: Gemini was morphing user faces toward garment-model faces (catalog photos show different people wearing the clothes). I solved this with an identity-lock prompt, a multi-paragraph instruction repeated at the start, middle, and end of the prompt that forces the model to preserve the user’s face, skin tone, and body from their photo while discarding any human features from the garment images.</p>

<hr />

<h2 id="preference-engine">Preference Engine</h2>

<p>The preference calculation is a weighted process.</p>

<p>Likes have less weight than Saves. And both likes are saves are weighted again by the recency. A users tastes may change over the course. Save done within last 30 days had more weight than those done in last 60 or 90 days. A Like or save done before this year had no impact and were discarded.</p>

<p>After taking top weighted Saves and Likes, we analyze the attributes of the individual articles such as size, fabric brand and also attributes of the outfit such as color paltte.</p>

<p>In addition we also take frequently appearing key words in product descriptions as attributes too.</p>

<p>then when user makes a search for an outfit, if the product descriptions contain those key words and fit the most frequent attribute values, they are scored. Top 3 scored outfits are provided as recommendations.</p>

<hr />

<h2 id="changes-in-production">Changes in Production</h2>

<p>Since this is a demo done for a hackathon it obviously lacked lot of important details. Here’s what must be changed if we plan to move with this project.</p>

<ul>
  <li>For the demonstration we used pre-scraped data as scraping process was not optimized and takes too long, this must be optimized.</li>
  <li>Currently the products are fetched solely on vector similarity of their product descriptions and the results are only mildly satistfying. This should be integrated with a vision model to improve results as well as recommendations.</li>
  <li>Gemini being a generative model means the try-ons are not accurate but instead just generated to look accurate, we must switch to actual virtual try on models.</li>
  <li>Brand agnostic autonoumous check out must be reviewed to see if it complies with rules, guidenlines and standards of regions and data security must be implemented.</li>
</ul>

<hr />

<h2 id="conclusion">Conclusion</h2>

<p>Bloom demonstrates that agentic systems can be both genuinely autonomous and reliably bounded. The key patterns:</p>

<ol>
  <li>Specialist agents with single responsibilities : each agent does one thing well</li>
  <li>Deterministic coordination, LLM decisions :the spine is predictable; the judgment is intelligent</li>
  <li>Reflection loops with hard bounds : the system self-corrects but can’t loop forever</li>
  <li>Multi-vendor critique : the reviewer and the creator are independent</li>
  <li>Human-in-the-loop for irreversible actions : full autonomy up to the payment boundary</li>
  <li>Graceful degradation : every agent can fail without crashing the system</li>
  <li>Transparent execution : the user watches the agents work, building trust</li>
</ol>]]></content><author><name>Thaarushi Herath</name></author><category term="AI" /><category term="Agents" /><category term="Engineering" /><category term="Multi-Agent Systems" /><category term="FastAPI" /><category term="Next.js" /><category term="Gemini" /><category term="Agentic AI" /><category term="Hackathon" /><summary type="html"><![CDATA[How we built Bloom, a multi-agent AI stylist that won the SuperAI 2026 NEXT hackathon, featuring reflection loops, a preference engine, and virtual try-on.]]></summary></entry><entry><title type="html">Chart Generation</title><link href="https://thaarushin.github.io/2026/01/22/chart-generation/" rel="alternate" type="text/html" title="Chart Generation" /><published>2026-01-22T00:00:00+05:30</published><updated>2026-01-22T00:00:00+05:30</updated><id>https://thaarushin.github.io/2026/01/22/chart-generation</id><content type="html" xml:base="https://thaarushin.github.io/2026/01/22/chart-generation/"><![CDATA[<h2 id="chart-generation-using-an-llm">Chart Generation Using an LLM</h2>

<p>In the previous article, we talked about how we read spreadsheets without compromising accuracy or performance. But data is not really impactful if it is not visualized so today we will be discussing how we got our document analyzer to generate a chart.</p>

<p>The first step was defining a tool interface the LLM could reliably invoke. A tool call is when an LLM recognizes that it needs to perform some action outside of its current capability to answer the user query and needs to call an outside API or service. An LLM can only generate text by itself so a tool call will greatly improve its capabilities. In our case, the LLM has to generate a tool call to call on a function that generates charts.</p>

<p>To define a tool call, we need to look at the function (the tool). There are different types of chart that we need to generate based on the nature of our data. This function should be able to handle the basic chart types needed to visualize data. Then it needs x data, y data and names for x and y axis.</p>

<p>Here’s the pseudo-code for the function that I designed. It requires helper functions for each chart type. It can visualize multiple y data as well, depending on the chart type</p>

<div class="language-text highlighter-rouge"><div class="highlight"><pre class="highlight"><code>FUNCTION draw_chart(chart_type, x_data, y_series_data, y_series_names, axis_x, axis_y, title):

    CREATE a new chart object of type chart_type

    FOR each index i from 0 to length of y_series_data - 1 DO
        series_data ← y_series_data[i]
        series_name ← y_series_names[i]
        ADD series_data to chart using x_data as X values
        LABEL the series with series_name
    END FOR

    SET X-axis label to axis_x
    SET Y-axis label to axis_y
    SET chart title to title

    DISPLAY the chart on screen

END FUNCTION
</code></pre></div></div>

<p>In addition to the helper functions generating each supported chart_type, there are two other helper functions. First one ensures that both x_data and elements of y_series_data (y_series_data is a list of lists) have the same length. The other helper function is to check whether x_data is safe to convert to numerical values, and if so convert.</p>

<p>Now that the tool is done, let’s design the tool call. I used JSON to design it as it is a format that the LLM can infer easily.</p>

<div class="language-json highlighter-rouge"><div class="highlight"><pre class="highlight"><code><span class="err">tool_func</span><span class="w"> </span><span class="err">=</span><span class="w"> </span><span class="p">[</span><span class="w">
    </span><span class="p">{</span><span class="w">
        </span><span class="nl">"name"</span><span class="p">:</span><span class="w"> </span><span class="s2">"draw_chart"</span><span class="p">,</span><span class="w">
        </span><span class="nl">"description"</span><span class="p">:</span><span class="w"> </span><span class="err">(</span><span class="w">
            </span><span class="s2">"Generate a chart (bar, line, scatter, pie) given x-axis values, "</span><span class="w">
            </span><span class="s2">"multiple y-series, qualitative categories, and axis labels/title."</span><span class="w">
        </span><span class="err">)</span><span class="p">,</span><span class="w">
        </span><span class="nl">"parameters"</span><span class="p">:</span><span class="w"> </span><span class="p">{</span><span class="w">
            </span><span class="nl">"type"</span><span class="p">:</span><span class="w"> </span><span class="s2">"object"</span><span class="p">,</span><span class="w">
            </span><span class="nl">"properties"</span><span class="p">:</span><span class="w"> </span><span class="p">{</span><span class="w">
                </span><span class="nl">"chart_type"</span><span class="p">:</span><span class="w"> </span><span class="p">{</span><span class="w">
                    </span><span class="nl">"type"</span><span class="p">:</span><span class="w"> </span><span class="s2">"string"</span><span class="p">,</span><span class="w">
                    </span><span class="nl">"enum"</span><span class="p">:</span><span class="w"> </span><span class="p">[</span><span class="s2">"bar"</span><span class="p">,</span><span class="w"> </span><span class="s2">"line"</span><span class="p">,</span><span class="w"> </span><span class="s2">"scatter"</span><span class="p">,</span><span class="w"> </span><span class="s2">"pie"</span><span class="p">],</span><span class="w">
                    </span><span class="nl">"description"</span><span class="p">:</span><span class="w"> </span><span class="s2">"The type of chart to create."</span><span class="w">
                </span><span class="p">},</span><span class="w">
                </span><span class="nl">"x_data"</span><span class="p">:</span><span class="w"> </span><span class="p">{</span><span class="w">
                    </span><span class="nl">"type"</span><span class="p">:</span><span class="w"> </span><span class="s2">"array"</span><span class="p">,</span><span class="w">
                    </span><span class="nl">"items"</span><span class="p">:</span><span class="w"> </span><span class="p">{</span><span class="nl">"type"</span><span class="p">:</span><span class="w"> </span><span class="s2">"string"</span><span class="p">},</span><span class="w">
                    </span><span class="nl">"description"</span><span class="p">:</span><span class="w"> </span><span class="s2">"List of values for the x-axis (qualitative or quantitative)."</span><span class="w">
                </span><span class="p">},</span><span class="w">
                </span><span class="nl">"y_series_data"</span><span class="p">:</span><span class="w"> </span><span class="p">{</span><span class="w">
                    </span><span class="nl">"type"</span><span class="p">:</span><span class="w"> </span><span class="s2">"array"</span><span class="p">,</span><span class="w">
                    </span><span class="nl">"items"</span><span class="p">:</span><span class="w"> </span><span class="p">{</span><span class="nl">"type"</span><span class="p">:</span><span class="w"> </span><span class="s2">"array"</span><span class="p">,</span><span class="w"> </span><span class="nl">"items"</span><span class="p">:</span><span class="w"> </span><span class="p">{</span><span class="nl">"type"</span><span class="p">:</span><span class="w"> </span><span class="s2">"number"</span><span class="p">}},</span><span class="w">
                    </span><span class="nl">"description"</span><span class="p">:</span><span class="w"> </span><span class="s2">"A list of lists, where each inner list is a numeric data series corresponding to x_data. Use a single inner list for one series."</span><span class="w">
                </span><span class="p">},</span><span class="w">
                </span><span class="nl">"y_series_names"</span><span class="p">:</span><span class="w"> </span><span class="p">{</span><span class="w">
                    </span><span class="nl">"type"</span><span class="p">:</span><span class="w"> </span><span class="s2">"array"</span><span class="p">,</span><span class="w">
                    </span><span class="nl">"items"</span><span class="p">:</span><span class="w"> </span><span class="p">{</span><span class="nl">"type"</span><span class="p">:</span><span class="w"> </span><span class="s2">"string"</span><span class="p">},</span><span class="w">
                    </span><span class="nl">"description"</span><span class="p">:</span><span class="w"> </span><span class="s2">"List of names for each numeric series in y_series_data (e.g., ['Sales', 'Profit'])."</span><span class="w">
                </span><span class="p">},</span><span class="w">
                </span><span class="nl">"axis_x"</span><span class="p">:</span><span class="w"> </span><span class="p">{</span><span class="w">
                    </span><span class="nl">"type"</span><span class="p">:</span><span class="w"> </span><span class="s2">"string"</span><span class="p">,</span><span class="w">
                    </span><span class="nl">"description"</span><span class="p">:</span><span class="w"> </span><span class="s2">"Label for the x-axis."</span><span class="w">
                </span><span class="p">},</span><span class="w">
                </span><span class="nl">"axis_y"</span><span class="p">:</span><span class="w"> </span><span class="p">{</span><span class="w">
                    </span><span class="nl">"type"</span><span class="p">:</span><span class="w"> </span><span class="s2">"string"</span><span class="p">,</span><span class="w">
                    </span><span class="nl">"description"</span><span class="p">:</span><span class="w"> </span><span class="s2">"Label for the y-axis."</span><span class="w">
                </span><span class="p">},</span><span class="w">
                </span><span class="nl">"title"</span><span class="p">:</span><span class="w"> </span><span class="p">{</span><span class="w">
                    </span><span class="nl">"type"</span><span class="p">:</span><span class="w"> </span><span class="s2">"string"</span><span class="p">,</span><span class="w">
                    </span><span class="nl">"description"</span><span class="p">:</span><span class="w"> </span><span class="s2">"Title of the chart."</span><span class="w">
                </span><span class="p">}</span><span class="w">
            </span><span class="p">},</span><span class="w">
            </span><span class="nl">"required"</span><span class="p">:</span><span class="w"> </span><span class="p">[</span><span class="w">
                </span><span class="s2">"chart_type"</span><span class="p">,</span><span class="w">
                </span><span class="s2">"x_data"</span><span class="p">,</span><span class="w">
                </span><span class="s2">"y_series_data"</span><span class="p">,</span><span class="w">
                </span><span class="s2">"y_series_names"</span><span class="p">,</span><span class="w">
                </span><span class="s2">"axis_x"</span><span class="p">,</span><span class="w">
                </span><span class="s2">"axis_y"</span><span class="p">,</span><span class="w">
                </span><span class="s2">"title"</span><span class="w">
            </span><span class="p">],</span><span class="w">
            </span><span class="nl">"additionalProperties"</span><span class="p">:</span><span class="w"> </span><span class="err">False</span><span class="w">
        </span><span class="p">}</span><span class="w">
    </span><span class="p">}</span><span class="w">
</span><span class="p">]</span><span class="w">
</span></code></pre></div></div>

<p>Here, the “name” property is the same as the name of our tool function and the description is a comprehensive description of what the tool call is for. Then the most important part, parameters come in.</p>

<p>Parameters are what we are passing to the function. The LLM should follow the format of the tool call and organize our data the way the function requires. The chart types parameter explicitly states what types of charts we are supporting. Then the x_data parameter is an array of Strings as x_data can be either quantitative or qualitative depending on the chart type. Our tool handles this by checking whether it is safe to convert x_data to numeric data by using the helper function we talked about earlier. Other than these, the LLM also generates x-axis and y-axis names, the chart title and a description before sending these out as a tool call.</p>

<p>The parent function (LLM orchestration function) determines whether the response is a tool call or a regular response and acts accordingly.</p>]]></content><author><name>Thaarushi Herath</name></author><category term="AI" /><category term="Engineering" /><category term="Visualization" /><category term="LLM" /><category term="Tool Calling" /><category term="Data Visualization" /><category term="JSON" /><category term="Python" /><summary type="html"><![CDATA[Discussing how we got our document analyzer to generate a chart using tool interfaces and LLM invocation.]]></summary></entry><entry><title type="html">Handling Tabular Data in a RAG System</title><link href="https://thaarushin.github.io/2026/01/20/handling-tabular-data-in-a-rag-system/" rel="alternate" type="text/html" title="Handling Tabular Data in a RAG System" /><published>2026-01-20T00:00:00+05:30</published><updated>2026-01-20T00:00:00+05:30</updated><id>https://thaarushin.github.io/2026/01/20/handling-tabular-data-in-a-rag-system</id><content type="html" xml:base="https://thaarushin.github.io/2026/01/20/handling-tabular-data-in-a-rag-system/"><![CDATA[<h2 id="storing-and-retrieving-tabular-data">Storing and Retrieving Tabular Data</h2>

<p>In our last article, I talked about how I handled concurrency in the RAG system. Today, I want to talk about another challenge that came across when developing this Document Analyzer system: <strong>reading spreadsheets</strong>.</p>

<p>Azure Document Intelligence supports Excel formats and can be used to extract information from spreadsheets. It can detect tables when they are explicitly and well-defined. But the catch is, for unformatted sheets, it reads each cell from left to right and just outputs the values sequentially, not preserving the table structure or column-row mappings.</p>

<p>One way to mitigate this is to loop the data and manually map them using row and column counts. But this massive loop will take some time for a large spreadsheet with several sheets and that could lead to user dissatisfaction. So I wanted to implement a strategy that reads tables fast while preserving the structure.</p>

<p>I thought of how we read tables for typical data analysis tasks, using Pandas, into a dataframe. Can we not store a dataframe in a vector database? Luckily for us, Pandas has this function:</p>

<div class="language-python highlighter-rouge"><div class="highlight"><pre class="highlight"><code><span class="n">df_string</span> <span class="o">=</span> <span class="n">df</span><span class="p">.</span><span class="n">to_string</span><span class="p">()</span>

</code></pre></div></div>

<p>This converts a dataframe to a string and stores it. The LLM can then infer its structure without the aid of a loop. But we need a more refined algorithm to read the spreadsheets. There are two types of sheets: those that have proper Excel tables and the others that just have data without any table formatting.</p>

<h2 id="identifying-headers-in-unformatted-sheets">Identifying Headers in Unformatted Sheets</h2>

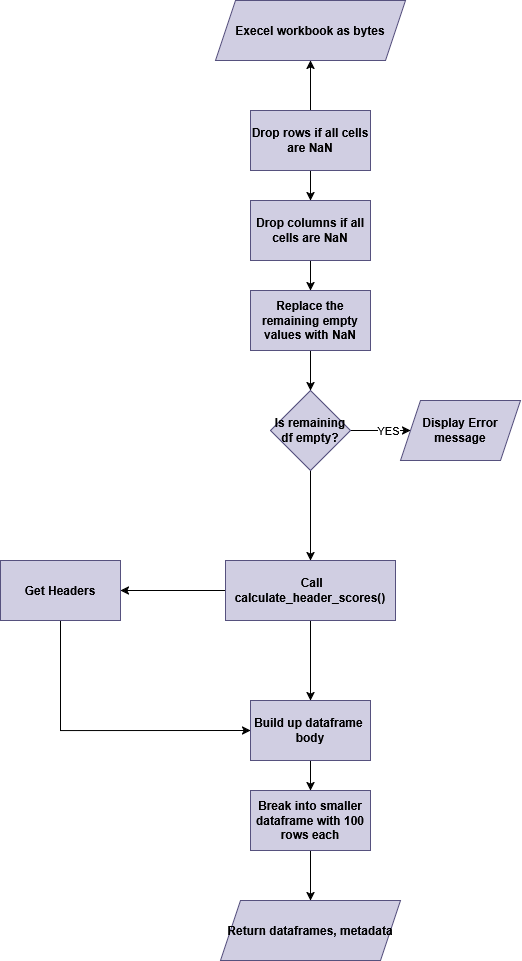
<p>When reading data without table formatting, we have to identify which are data rows and which is the header row. To decide which of the top <em>k</em> rows is the header row, the following metrics need to be calculated:</p>

<ul>
  <li><strong>non null:</strong> <code class="language-plaintext highlighter-rouge">number of non null cells / total number of cells in the row</code></li>
  <li><strong>uppercase:</strong> <code class="language-plaintext highlighter-rouge">number of UPPERCASE cells / total number of cells in the row</code></li>
  <li><strong>short text:</strong> <code class="language-plaintext highlighter-rouge">number of short-text cells / total number of cells in the row</code></li>
  <li><strong>numeric:</strong> <code class="language-plaintext highlighter-rouge">number of numeric cells / total number of cells in the row</code></li>
  <li><strong>non-alpha-numerics:</strong> <code class="language-plaintext highlighter-rouge">number of symbol-dominant cells / total number of cells in the row</code></li>
</ul>

<p>These metrics are decided using the heuristic knowledge that the header row will not have null cells, is more likely to contain uppercase text, and is less likely to have numeric, non-alphanumeric characters, or short text (more than 50 characters long).</p>

<p>After calculating these metrics, we compare them with the row below (which we assume to be data rows at the moment). If the rows below are date/numeric heavy, then the candidate row gets a boost; otherwise, it doesn’t. This allows us to capture the distributional shift between header and data rows. Afterward, we penalize less header-like traits and reward header-like traits and return a single number as a score. Using this score, we decide which one is the header row among the top <em>k</em> rows.</p>

<p>Then we use the following algorithm to convert the data into a dataframe.</p>

<figure class=""><img src="/assets/images/Headerless.drawio.png" alt="FlowChart for headerless table reading" /><figcaption>
      Figure 1: Flow chart of headerless Excel reading logic.

    </figcaption></figure>

<h2 id="the-ingestion-strategy">The Ingestion Strategy</h2>

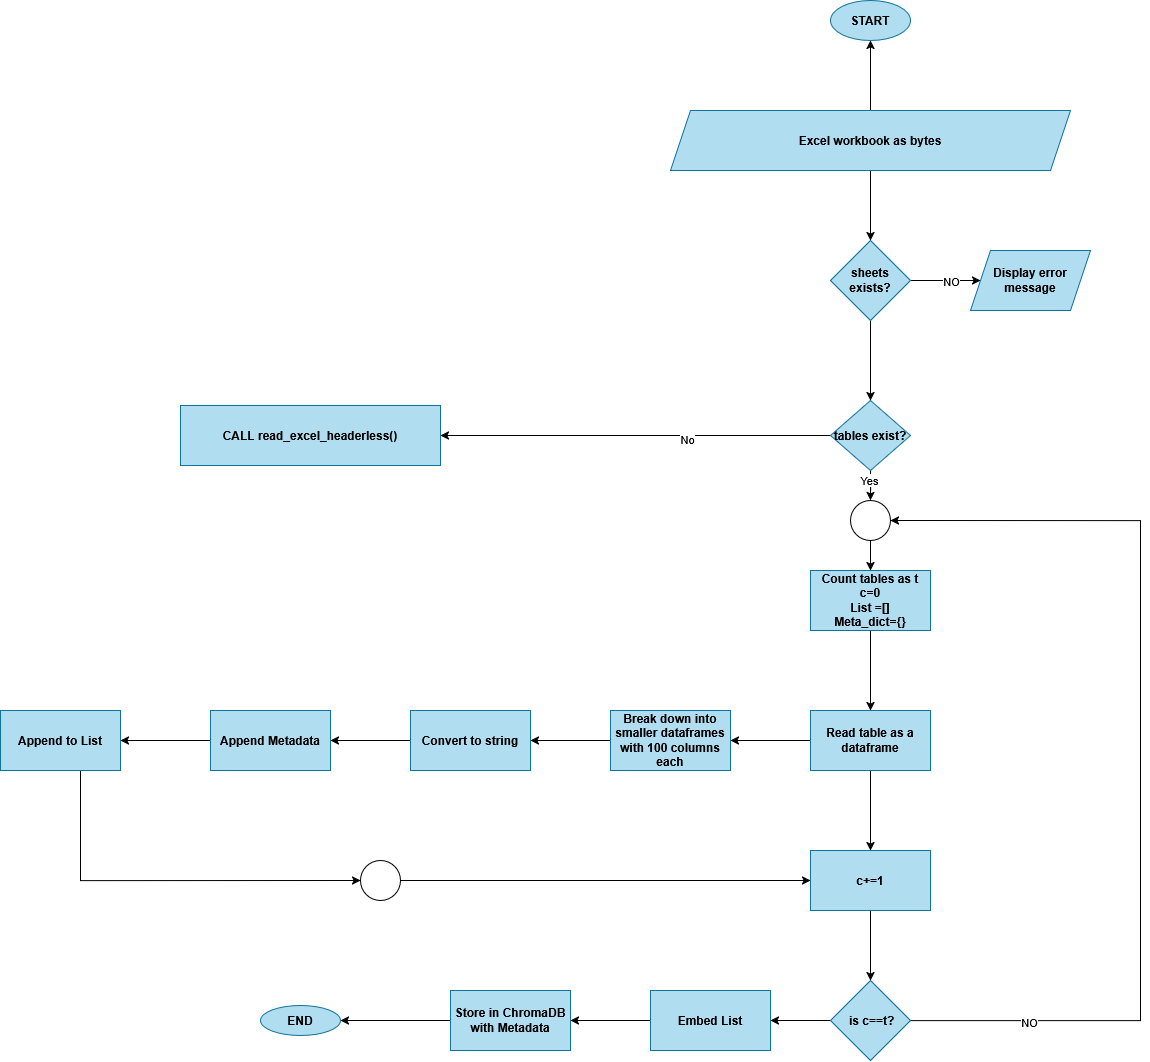
<p>In our <code class="language-plaintext highlighter-rouge">read_sheets()</code> function, we load each notebook as bytes and go through each of the sheets looking for tables.</p>

<ol>
  <li><strong>If there are tables:</strong> We store <code class="language-plaintext highlighter-rouge">filename</code>, <code class="language-plaintext highlighter-rouge">sheetname</code>, <code class="language-plaintext highlighter-rouge">tablename</code>, and <code class="language-plaintext highlighter-rouge">headers</code> as metadata.</li>
  <li><strong>Chunking:</strong> We convert said tables into dataframes and break them down into smaller dataframes consisting of the header row and 100 rows.</li>
  <li><strong>Storage:</strong> This is converted to a string, embedded, and stored in the ChromaDB.</li>
</ol>

<p>For spreadsheets without table formatting, where we have to calculate and determine what the header is, we also store the <strong>index of the header row</strong> in addition to the typical metadata.</p>

<p>When answering a user query, the LLM can not only pluck out the answer easily from the dataframe converted to string, but it can also provide formulas and other references to the columns, tables, and sheets containing information using the metadata.</p>

<p>Here’s the flow chart for the <code class="language-plaintext highlighter-rouge">read_sheets()</code> function:</p>

<figure class=""><img src="/assets/images/read-excel-function.png" alt="Logic for reading an excel into a dataframe" /><figcaption>
      Figure 2: Flow chart for reading Excels.

    </figcaption></figure>

<h2 id="conclusion">Conclusion</h2>

<p>The goal here was to retrieve data as accurately as possible, with the context and metadata, and to reduce the performance overhead.</p>

<p>To conclude, spreadsheets require a different ingestion strategy than unstructured documents in a RAG system. Instead of reconstructing tables cell by cell, this approach preserves structure by converting tables into DataFrames and storing them as strings with rich metadata. Lightweight heuristics are used to reliably detect headers in loosely formatted sheets without expensive processing. Chunking tables into smaller, consistent units keeps retrieval efficient and scalable. Together, this design balances accuracy, performance, and practicality in production environments.</p>]]></content><author><name>Thaarushi Herath</name></author><category term="AI" /><category term="Engineering" /><category term="RAG" /><category term="Pandas" /><category term="Excel" /><category term="Azure" /><category term="Data Engineering" /><category term="Algorithms" /><summary type="html"><![CDATA[A heuristic approach to extracting and structuring tabular data from unformatted spreadsheets for better RAG context.]]></summary></entry><entry><title type="html">Document Reading with Azure Document Intelligence</title><link href="https://thaarushin.github.io/2026/01/19/document-reading-with-azure-document-intelligence/" rel="alternate" type="text/html" title="Document Reading with Azure Document Intelligence" /><published>2026-01-19T00:00:00+05:30</published><updated>2026-01-19T00:00:00+05:30</updated><id>https://thaarushin.github.io/2026/01/19/document-reading-with-azure-document-intelligence</id><content type="html" xml:base="https://thaarushin.github.io/2026/01/19/document-reading-with-azure-document-intelligence/"><![CDATA[<h1 id="document-reading-with-azure-document-intelligence">Document Reading with Azure Document Intelligence</h1>

<p>In the last post, we discussed how the architecture for the Document Analyzer was designed. Now we have to think about how to actually ‘read’ our documents. This article is about the challenge of reading large documents without taking too long and driving the users insane.</p>

<p>When I first started this project, I used LLM Sherpa’s LayoutPDFReader. But then I realized that this is simply not enough. It cannot extract text from OCR documents, and it didn’t support all file types, just PDFs. That’s how I got to know about Azure Document Intelligence.</p>

<h2 id="first-we-need-to-import-the-document-intelligence-client">First we need to import the Document Intelligence client.</h2>

<div class="language-python highlighter-rouge"><div class="highlight"><pre class="highlight"><code><span class="kn">from</span> <span class="nn">azure.ai.documentintelligence.aio</span> <span class="kn">import</span> <span class="n">DocumentIntelligenceClient</span>
</code></pre></div></div>

<h2 id="types-of-clients">Types of Clients</h2>

<p>A rookie mistake that I made is not knowing there are two types of DI clients. There is a sync client and also an async client. What the sync client does is when you are reading a document, it blocks execution and waits for that operation to finish. This will hold you up. But when you use the async client, it only initiates the operation and returns control to the program, allowing other operations to run alongside it. It still waits for the remote operation without blocking the entire worker. This way, the UVICORN worker will not be held up when you are processing a long document. So we have imported the async client here.</p>

<p>Then we need to load our environment variables just like we did before. And now we move on to actual text extraction.</p>

<h2 id="text-extraction">Text Extraction</h2>

<p>Here is the function that I use to extract text. The result of this is either markdown text or a plain string of text in our document.</p>

<div class="language-python highlighter-rouge"><div class="highlight"><pre class="highlight"><code><span class="k">async</span> <span class="k">def</span> <span class="nf">_analyze_window_markdown</span><span class="p">(</span>
    <span class="n">client</span><span class="p">:</span> <span class="n">DocumentIntelligenceClient</span><span class="p">,</span>
    <span class="o">*</span><span class="p">,</span>
    <span class="n">pdf_bytes</span><span class="p">:</span> <span class="n">Optional</span><span class="p">[</span><span class="nb">bytes</span><span class="p">],</span>
    <span class="n">pages_expr</span><span class="p">:</span> <span class="nb">str</span><span class="p">,</span>  
<span class="p">)</span> <span class="o">-&gt;</span> <span class="nb">str</span><span class="p">:</span>
    
    <span class="k">if</span> <span class="ow">not</span> <span class="n">pdf_bytes</span><span class="p">:</span>
        <span class="k">raise</span> <span class="nb">RuntimeError</span><span class="p">(</span><span class="s">" no pdf_bytes were provided"</span><span class="p">)</span>
    <span class="n">req</span> <span class="o">=</span> <span class="n">AnalyzeDocumentRequest</span><span class="p">(</span><span class="n">bytes_source</span><span class="o">=</span><span class="n">pdf_bytes</span><span class="p">)</span>

    <span class="n">poller</span> <span class="o">=</span> <span class="k">await</span> <span class="n">client</span><span class="p">.</span><span class="n">begin_analyze_document</span><span class="p">(</span>
        <span class="s">"prebuilt-layout"</span><span class="p">,</span>
        <span class="n">req</span><span class="p">,</span>
        <span class="n">pages</span><span class="o">=</span><span class="n">pages_expr</span><span class="p">,</span>                                  
        <span class="n">output_content_format</span><span class="o">=</span><span class="n">DocumentContentFormat</span><span class="p">.</span><span class="n">MARKDOWN</span>
    <span class="p">)</span>
    <span class="n">result</span> <span class="o">=</span> <span class="k">await</span> <span class="n">poller</span><span class="p">.</span><span class="n">result</span><span class="p">()</span>  

    <span class="c1"># result should have .content when MARKDOWN is requested
</span>    <span class="k">if</span> <span class="nb">hasattr</span><span class="p">(</span><span class="n">result</span><span class="p">,</span> <span class="s">"content"</span><span class="p">)</span> <span class="ow">and</span> <span class="n">result</span><span class="p">.</span><span class="n">content</span><span class="p">:</span>
        <span class="k">return</span> <span class="n">result</span><span class="p">.</span><span class="n">content</span>
    <span class="c1"># fallback if it returns a plain string
</span>    <span class="k">if</span> <span class="nb">isinstance</span><span class="p">(</span><span class="n">result</span><span class="p">,</span> <span class="nb">str</span><span class="p">):</span>
        <span class="k">return</span> <span class="n">result</span>
    <span class="k">return</span> <span class="s">""</span> 
</code></pre></div></div>

<h2 id="concurrent-processing">Concurrent Processing</h2>

<p>When I first implemented this, I noticed that it took so long to process a PDF and I wanted to make it faster. This is where I learnt about concurrency properly and this is also where this project stood different from my academic projects.</p>

<p>The solution I came up with for this was to break down the PDF into page windows and concurrently process those windows.</p>

<h3 id="attempt-01">Attempt 01</h3>

<p>I used a local semaphore inside each worker to limit how many windows that worker could process in parallel. It worked but only within a single worker.
With multiple Uvicorn workers, each one had its own semaphore. That meant total concurrency was:</p>

<div class="language-plaintext highlighter-rouge"><div class="highlight"><pre class="highlight"><code>number of workers × local limit
</code></pre></div></div>

<p>So instead of protecting the API, I accidentally multiplied the load. Not ideal.</p>

<h3 id="attempt-02">Attempt 02</h3>

<p>To enforce a true global limit, I created a Redis-based semaphore:</p>

<ul>
  <li>A Redis list holds “tokens”</li>
  <li>Each token represents permission to send one DI request</li>
  <li>A worker must acquire a token before calling DI</li>
  <li>When finished, it releases the token</li>
</ul>

<p>This centralizes the concurrency limit, exactly what I wanted.</p>

<p>But then I hit the next issue.</p>

<h2 id="the-worker-startup-problem">The Worker Startup Problem</h2>

<p>Because each Uvicorn worker is its own process, they all ran the “seed tokens into Redis” logic. The result?</p>

<div class="language-plaintext highlighter-rouge"><div class="highlight"><pre class="highlight"><code>GLOBAL_DI_REQ_LIMIT × number of workers
</code></pre></div></div>

<p>Again, not ideal.</p>

<p>I fixed this by adding a simple SETNX flag in Redis to ensure that only the first worker initializes the token list. The others skip it.</p>

<h2 id="the-subtle-starvation-issue">The Subtle Starvation Issue</h2>

<p>Even after that, I ran into one last problem: workers were acquiring tokens during startup. That meant:</p>

<ul>
  <li>A worker could grab tokens even if it didn’t actually have DI work to do</li>
  <li>And if it never used DI, it never released them</li>
  <li>Meanwhile, workers that did have work were stuck waiting</li>
</ul>

<h2 id="the-final-model-what-actually-works">The Final Model (What Actually Works)</h2>

<p>The fix was simple and clean:</p>

<ul>
  <li>Workers only acquire tokens at the moment they actually need to call DI.</li>
  <li>They acquire only the number of tokens needed for the windows they are processing.</li>
</ul>

<p>Here’s the pseudo code of this logic.</p>

<hr />

<h1 id="multiworker_mgrpy"><code class="language-plaintext highlighter-rouge">multiworker_mgr.py</code></h1>

<div class="language-text highlighter-rouge"><div class="highlight"><pre class="highlight"><code>CONSTANT global_throttle=10
CONSTANT throttle_key='di_tokens'
CONSTANT token='t'

ASYNC DEF seed_semaphore():
    IF semaphore IS None:
        app.state.redis.lpush(throttle_key,([token]*global_throttle))

ASYNC DEF acquire_token():
    IF NOT timeout:
        token=app.state.redis.blpop(throttle_key)
        IF token NOT None:
            RETURN token
    RETURN None

ASYNC DEF release_token():
    app.state.redis.rpush(throttle_key,token)
</code></pre></div></div>

<p>Here, in this code, we populate a Redis list with tokens according to the GLOBAL_DI_REQ_LIMIT.</p>

<p>The <strong>blpop</strong> operation we do when we get a token blocks the coroutine if the list is empty and once the list has an element the operation can proceed.</p>

<hr />

<h1 id="document_processorpy"><code class="language-plaintext highlighter-rouge">document_processor.py</code></h1>

<div class="language-text highlighter-rouge"><div class="highlight"><pre class="highlight"><code>ASYNC DEF anayze_windows_concurrently():
    ASYNC DEF worker():
        AWAIT acquire_token():
        IF token IS NOT None:
            TRY:
                md=analyze_window_markdown()
                RETURN md
            EXCEPT:
                RETURN None
            FINALLY:
                AWAIT release_token()

    sem=asyncio.semaphore(3)

    ASYNC DEF limited_worker():
        WITH sem:
            RETURN AWAIT worker()
    
    result=AWAIT asyncio.gather(limited_worker(w) FOR w IN windows_list)
    //windows_list is a list with tuples (starting_page, end_page). its the page range of the window
    RETURN [(window_page_range, md) FOR md IN results]
</code></pre></div></div>

<p>In analyze_windows_concurrently, we create an async worker that acquires a token, calls analyze_window_markdown and then releases the said token when analysis is done. We set the local semaphore to limit the no of windows the worker is allowed to concurrently process. Then inside the limited_worker, we call the workers with the semaphore.</p>

<p><code class="language-plaintext highlighter-rouge">asyncio.gather</code> concurrently executes the limited_worker and gathers the result.</p>

<p>Not only this allowed me to concurrently process the documents, this logic can also be scaled by changing throttle limits. This is point where this system moved from just ‘working’ to ‘working reliably in production level environments’. And this is also where I understood the difference between an academic project that I did as a university student vs. industry projects.</p>]]></content><author><name>Thaarushi Herath</name></author><category term="AI" /><category term="Engineering" /><category term="Azure" /><category term="FastAPI" /><category term="Redis" /><category term="AsyncIO" /><category term="Concurrency" /><category term="Azure Document Intelligence" /><summary type="html"><![CDATA[Moving from local PDF parsing to scalable, asynchronous document reading using Azure and Redis-based concurrency control.]]></summary></entry><entry><title type="html">Designing a Session-Aware Document Analyzer: From Stateless RAG to Contextual Intelligence</title><link href="https://thaarushin.github.io/2025/11/11/designing-session-aware-document-analyzer-rag/" rel="alternate" type="text/html" title="Designing a Session-Aware Document Analyzer: From Stateless RAG to Contextual Intelligence" /><published>2025-11-11T12:05:00+05:30</published><updated>2025-11-11T12:05:00+05:30</updated><id>https://thaarushin.github.io/2025/11/11/designing-session-aware-document-analyzer-rag</id><content type="html" xml:base="https://thaarushin.github.io/2025/11/11/designing-session-aware-document-analyzer-rag/"><![CDATA[<h1 id="designing-a-session-aware-document-analyzer-from-stateless-rag-to-contextual-intelligence">Designing a Session-Aware Document Analyzer: From Stateless RAG to Contextual Intelligence</h1>

<p>Retrieval Augmented Generation (RAG) is when we use data retrieved from an external data source (such as a vector database) to enhance the response of a Large Language Model (LLM). The main reasons to do this are, first to provide the model a better context, secondly, to increase the factual accuracy of the answer.<br />
Where there is no retrieval mechanism, to answer a user query, the LLM solely relies on its pretrained knowledge. This knowledge cannot be considered completely factually correct. However, if we can fetch this knowledge and feed it to the LLM to enrich the response then we can get a better response.</p>

<p>Now, let us move on to document analysis. Confidential documents such as reports, contracts, spreadsheets etc. needs to be analyzed and cross referenced sometimes, rather than doing this manually, the aim is to leverage the power of AI and automate this task.</p>

<p>A major concern when dealing with confidential documents, is privacy. This is where sessions come into this design. Once a user session expires, all the data such as uploaded documents, raw text, vectors, chat history etc must be cleared. Not only that, one user should not be able to access another’s data under any circumstances.</p>

<hr />

<h2 id="architecture">Architecture</h2>

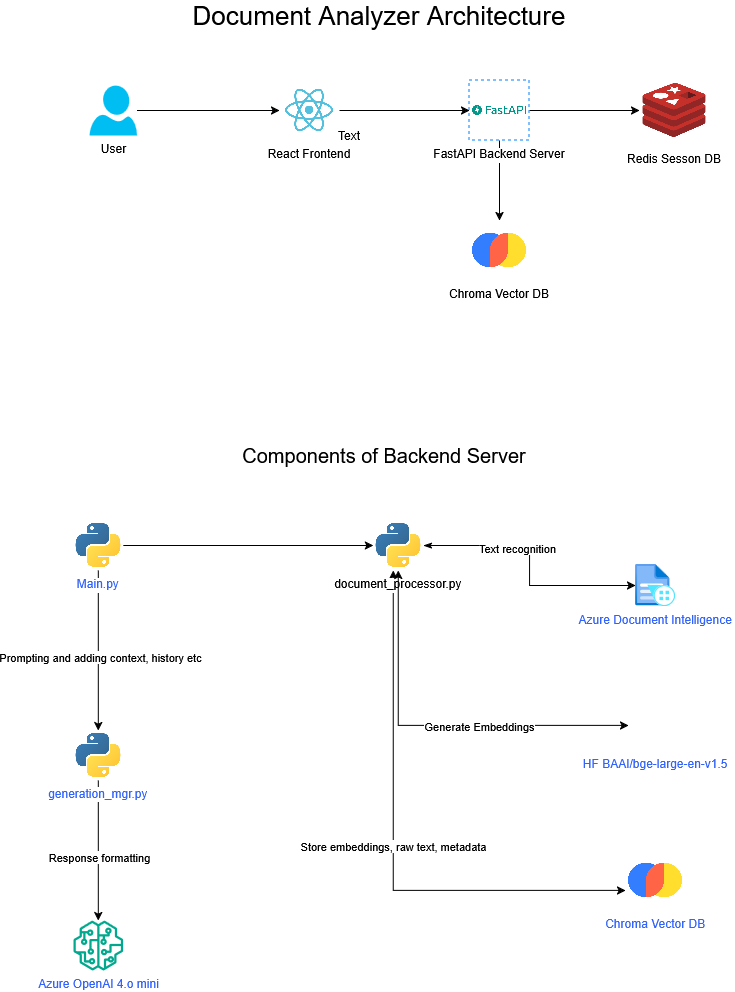
<figure class=""><img src="/assets/images/architecture-diagram.png" alt="System Architecture Diagram showing FastAPI, Redis, and ChromaDB" /><figcaption>
      Figure 1: High-level architecture of the Session-Aware Document Analyzer.

    </figcaption></figure>

<h3 id="techstack">Techstack</h3>
<p><strong>Python FastAPI</strong></p>

<p>Using Python for any AI/ML related application is self explanatory. So, let’s discuss why FastAPI specifically.</p>

<p>FastAPI is built on ASGI (Asynchronous Server Gateway Interface). What that means is it supports asynchronous and concurrent request handling. FastAPI also uses Pydantic for schema creation and type handling, give you control over what your data looks like and validating it. Personally, I also found FastAPI to easier to grasp, with little to no learning curve.</p>

<p><strong>ReactJS</strong></p>

<p>This one is also somewhat self explanatory. FastAPI integrates well with ReactJS, making API connection smoother. ReactJS has a component based architecture, which makes it easier to integrate new features into the UI and also provides efficient rendering.</p>

<p><strong>Redis Session Database</strong></p>

<p>FastAPI is created with concurrency and scalability in mind. And this is achieved by deploying several FastAPI workers that can respond to requests simultaneously and handle traffic. But each of these workers are a separate OS process with their own memory and cache. But to sync the state of the whole backend server, they need a shared memory. This is where Redis comes handy. Redis acts as the shared memory for the whole application.</p>

<p>Another reason is, in order to stop the workers from overwhelming external services like Azure Document Intelligence, we must pull a request cap. Inorder to make all the workers abide by this, we need to utilize Redis. (We will be seeing more of this in the next sections)</p>

<p><strong>ChromaDB Persistent Database</strong></p>

<p>ChromaDB is a lightweight and open source vector database. When run in server mode, it is accessible as a separate process through a separate port. The actual storage could be configured to be a cloud storage, an SQL server or a local storage. In this case, we will be using the local storage.</p>

<p><strong>Azure Document Intelligence</strong></p>

<p>This is what gives our Document Analyzer the capability to ‘read’ documents. Document analyzer supports a wide range of images and documents types including OCR documents.</p>

<hr />
<p>There were several key challenges I encountered while designing, developing, and deploying this system:</p>

<ul>
  <li>Configuring faster processing through parallelism</li>
  <li>Preserving the structure of tabular data</li>
  <li>Handling CPU-heavy vs. I/O-heavy workloads</li>
  <li>Implementing tool-calling for tasks such as chart generation</li>
</ul>

<p>Follow along with this series to see how each of these challenges was addressed.</p>]]></content><author><name>Thaarushi Herath</name></author><category term="AI" /><category term="RAG" /><category term="Architecture" /><category term="FastAPI" /><category term="Redis" /><category term="ChromaDB" /><category term="Azure Document Intelligence" /><category term="ReactJS" /><summary type="html"><![CDATA[Architeturing a RAG pipeline]]></summary></entry></feed>