
Storing and Retrieving Tabular Data
In our last article, I talked about how I handled concurrency in the RAG system. Today, I want to talk about another challenge that came across when developing this Document Analyzer system: reading spreadsheets.
Azure Document Intelligence supports Excel formats and can be used to extract information from spreadsheets. It can detect tables when they are explicitly and well-defined. But the catch is, for unformatted sheets, it reads each cell from left to right and just outputs the values sequentially, not preserving the table structure or column-row mappings.
One way to mitigate this is to loop the data and manually map them using row and column counts. But this massive loop will take some time for a large spreadsheet with several sheets and that could lead to user dissatisfaction. So I wanted to implement a strategy that reads tables fast while preserving the structure.
I thought of how we read tables for typical data analysis tasks, using Pandas, into a dataframe. Can we not store a dataframe in a vector database? Luckily for us, Pandas has this function:
df_string = df.to_string()
This converts a dataframe to a string and stores it. The LLM can then infer its structure without the aid of a loop. But we need a more refined algorithm to read the spreadsheets. There are two types of sheets: those that have proper Excel tables and the others that just have data without any table formatting.
Identifying Headers in Unformatted Sheets
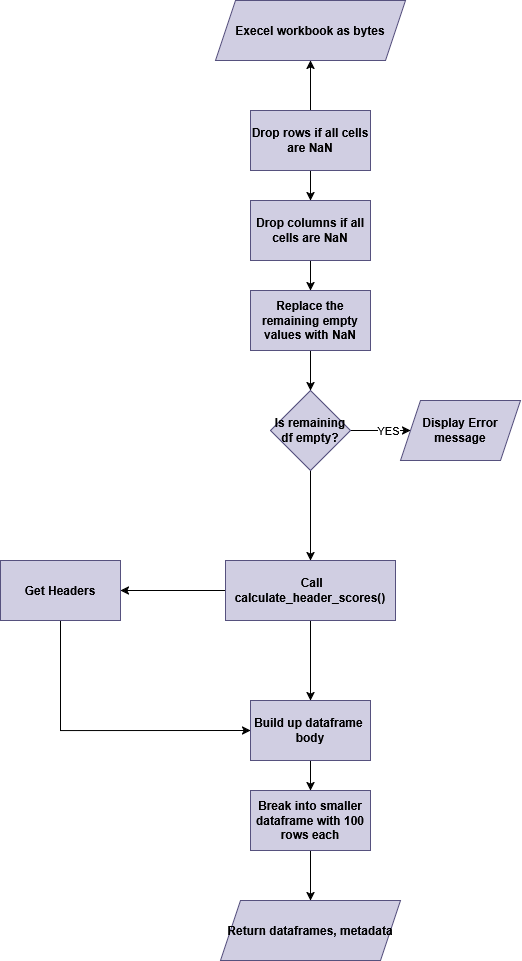
When reading data without table formatting, we have to identify which are data rows and which is the header row. To decide which of the top k rows is the header row, the following metrics need to be calculated:
- non null:
number of non null cells / total number of cells in the row - uppercase:
number of UPPERCASE cells / total number of cells in the row - short text:
number of short-text cells / total number of cells in the row - numeric:
number of numeric cells / total number of cells in the row - non-alpha-numerics:
number of symbol-dominant cells / total number of cells in the row
These metrics are decided using the heuristic knowledge that the header row will not have null cells, is more likely to contain uppercase text, and is less likely to have numeric, non-alphanumeric characters, or short text (more than 50 characters long).
After calculating these metrics, we compare them with the row below (which we assume to be data rows at the moment). If the rows below are date/numeric heavy, then the candidate row gets a boost; otherwise, it doesn’t. This allows us to capture the distributional shift between header and data rows. Afterward, we penalize less header-like traits and reward header-like traits and return a single number as a score. Using this score, we decide which one is the header row among the top k rows.
Then we use the following algorithm to convert the data into a dataframe.
The Ingestion Strategy
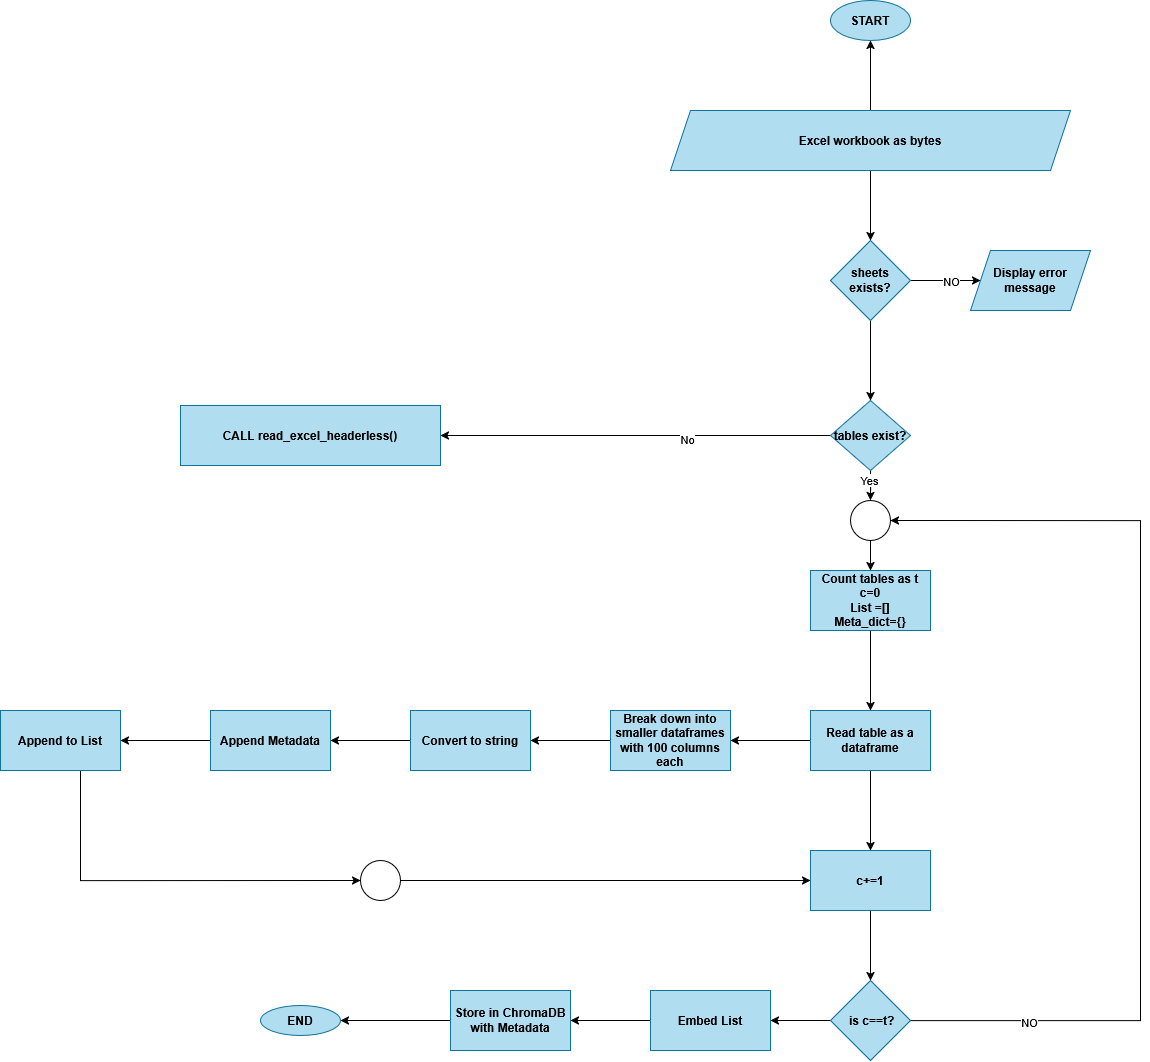
In our read_sheets() function, we load each notebook as bytes and go through each of the sheets looking for tables.
- If there are tables: We store
filename,sheetname,tablename, andheadersas metadata. - Chunking: We convert said tables into dataframes and break them down into smaller dataframes consisting of the header row and 100 rows.
- Storage: This is converted to a string, embedded, and stored in the ChromaDB.
For spreadsheets without table formatting, where we have to calculate and determine what the header is, we also store the index of the header row in addition to the typical metadata.
When answering a user query, the LLM can not only pluck out the answer easily from the dataframe converted to string, but it can also provide formulas and other references to the columns, tables, and sheets containing information using the metadata.
Here’s the flow chart for the read_sheets() function:
Conclusion
The goal here was to retrieve data as accurately as possible, with the context and metadata, and to reduce the performance overhead.
To conclude, spreadsheets require a different ingestion strategy than unstructured documents in a RAG system. Instead of reconstructing tables cell by cell, this approach preserves structure by converting tables into DataFrames and storing them as strings with rich metadata. Lightweight heuristics are used to reliably detect headers in loosely formatted sheets without expensive processing. Chunking tables into smaller, consistent units keeps retrieval efficient and scalable. Together, this design balances accuracy, performance, and practicality in production environments.